5 biggest warning signs coronavirus could get much worse this winter
Watch: Chief scientific adviser warns there could be 50,000 new daily coronavirus cases by mid-October
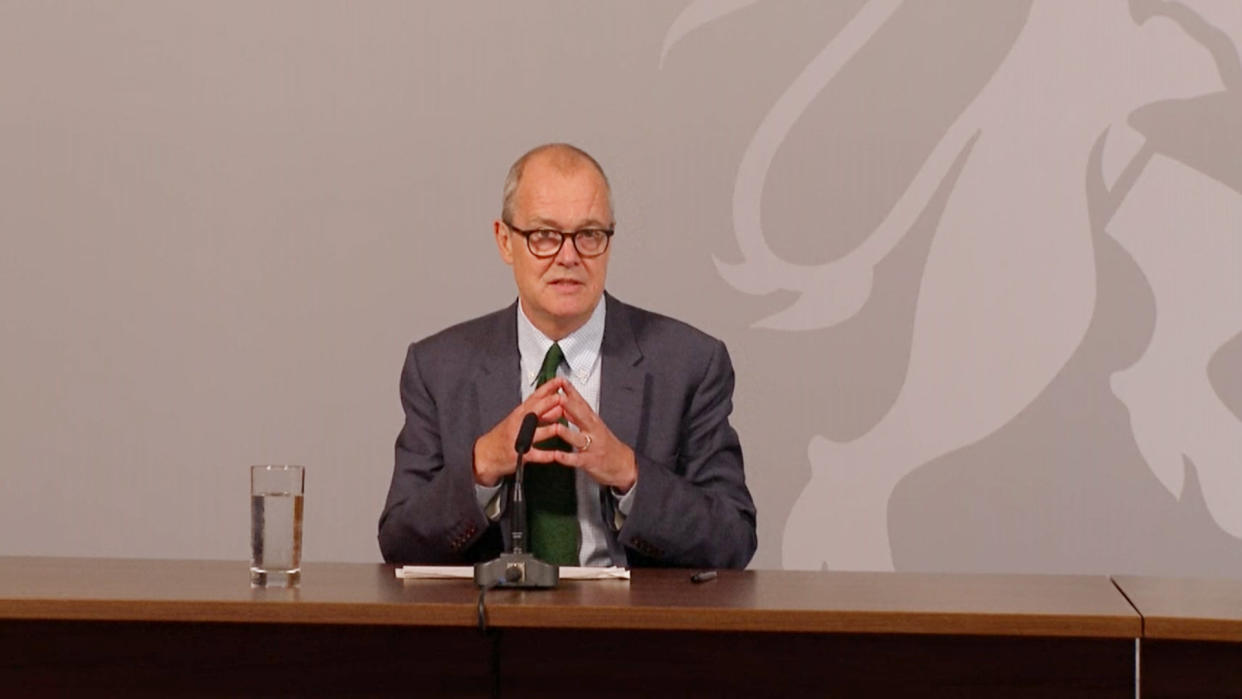
“There is the potential for this to move very fast,” Sir Patrick Vallance has warned as he explained why coronavirus could be so dangerous in the coming months.
Sir Patrick, the government’s chief scientific adviser, urged “speed and action” to slow the spread of the second wave of infections after setting out the latest infection data at a Downing Street media briefing on Monday.
Here are the five key warning signs discussed at the briefing...
1. UK likely to follow Spanish and French trend
Sir Patrick pointed to the rapid increase in infection rates in Spain and – to a lesser extent – France since June.
This has translated to increased death rate,s as demonstrated by the graphs below.

“It started with people in their 20s,” Sir Patrick said of the two countries, “and spread gradually to older ages as well.
“That increase in case numbers has translated into an increase in hospitalisations. As the hospitalisations have increased, very sadly but not unexpectedly, deaths are also increasing.”
Sir Patrick warned this trend can also be expected in the UK.
He added: “The virus has genetically moved a bit, but has not changed in terms of its propensity and ability to cause disease and cause death.”
2. 6,000 people a day are being infected
Sir Patrick referred to an Office for National Statistics (ONS) study that estimated about 6,000 people a day are being infected with the virus.
This compares with the government’s official testing data, which showed on Sunday there were 3,899 new confirmed cases on Sunday.
Sir Patrick also cited ONS data that estimated that roughly 70,000 people currently have COVID-19.
“We are in a situation where numbers are clearly increasing,” he said. “They are increasing across all age groups. This increase in numbers is also translating into an increase in hospitalisations.”
There were 205 hospitalisations in England on Friday (18 September), the last date for which admissions data is available. That compares with 56 on 18 August.
3. Infections are doubling every seven days
Sir Patrick said the epidemic is doubling “roughly” every seven days.
Presenting a graph (below) that shows what could happen if this continues unabated, he warned there could be just under 50,000 new cases a day by mid-October.

By the middle of November, this would lead to more than 200 deaths a day, Sir Patrick said.
“The challenge is to make sure the doubling time does not stay at seven days – there are already things in place that are expected to slow that – and to make sure we do not enter into this exponential growth,” he said
He called for “speed and action” to slow down the infection rate.
4. 92% of people don’t have antibodies
Sir Patrick said the number of people with antibodies is still low, making the “vast majority” of people “susceptible” to COVID-19.
Setting out the data, he warned: “What we see is that something under 8% of the population have been infected as we measure the antibodies.

“So 8%, about 3 million or so people, may have been infected and have antibodies.
“It means the vast majority of us are not protected in any way and are susceptible to this disease.”
He added that antibodies are not an “absolute protection” either, with immunity to the illness fading over time.
5. Infections increasing across majority of country
Prof Chris Whitty, England’s chief medical officer, pointed to maps (below) showing how the virus is quickly spreading across England.
The darker shades on the left-hand map demonstrate “significant rates of transmission”, Prof Whitty said, while the orange, yellow and brown shades on the right-hand map indicate the various areas where transmission is increasing.

Prof Whitty, warning this is now “not someone else’s problem”, said: “What we’ve seen is a progression where, after the remarkable efforts which got the rates right down across the country, first we saw very small outbreaks – maybe associated with a workplace or another environment – then we’ve seen more localised outbreaks which have got larger over time, particularity in the cities.
“And now what we’re seeing is a rate of increase across the great majority of the country.
“It is going at different rates but it is now increasing.
“And what we’ve found is, as we go through in time, anywhere that was falling is now moving over to beginning to rise and then the rate of rise continues in an upwards direction.”
Watch: What are the current UK government guidelines on face coverings within schools?
Coronavirus: what happened today
Click here to sign up to the latest news and information with our daily Catch-up newsletter


