
A look at where the 92 clubs rank in a calendar year league table for 2020

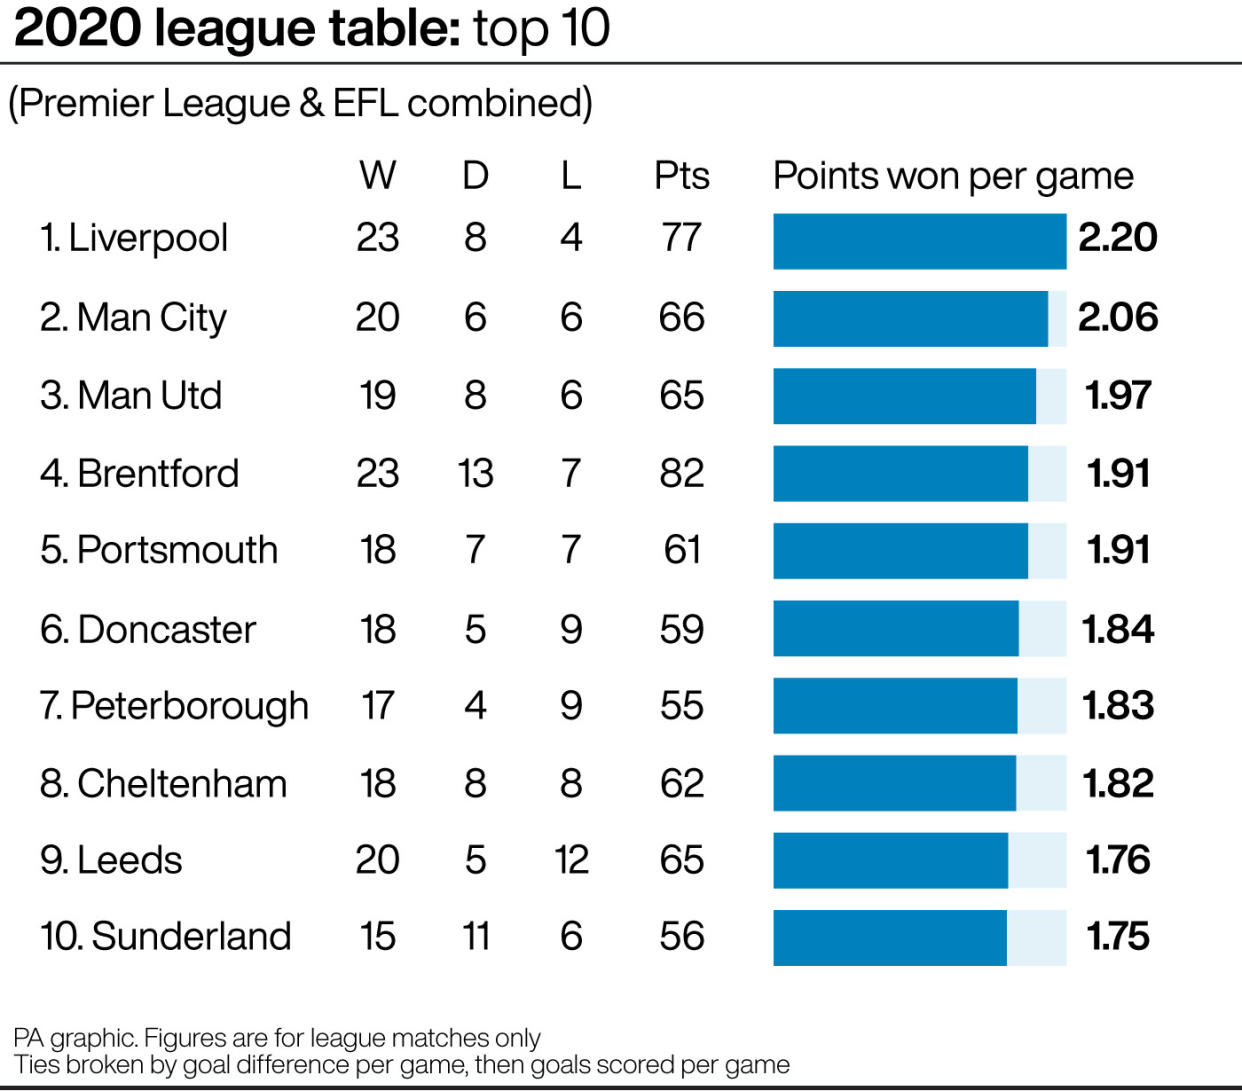
Liverpool’s dominance of 2020’s domestic footballing landscape is reflected in the 12-month league table – where there is also plenty for their rivals in Manchester to be optimistic about.
Jurgen Klopp’s Premier League champions have earned 77 points from 35 league games over the year, an average of 2.20 per game – comfortably the most of any team in the four English divisions, with Manchester City second and United, despite regular scrutiny of manager Ole Gunnar Solskjaer’s position, third.
At the other end of the standings, Stevenage are cast adrift at the bottom with the figures also demonstrating the problems facing both sides of the Sheffield rivalry.
Reds out on their own
The table ranks all 92 clubs on their league results in 2020, incorporating the end of last season and the current campaign to date. For EFL newcomers Barrow and Harrogate, that includes their National League promotion run-in and Harrogate’s play-off games.
Teams are sorted by points per game (PPG) – addressing the imbalance created by different numbers of fixtures, particularly after League One and League Two were curtailed early by the coronavirus pandemic. Any ties are then broken by goal difference and goals scored, again calculated on a per-game basis.
Liverpool began the year with eight successive wins, as part of a record-equalling Premier League run of 18, and finished their title-winning season by mixing six more wins with three defeats and two draws. They have won nine and lost only one of their first 16 this season to sit at the top of the table heading into 2021.
City are lagging behind in the season standings, albeit with two games in hand over the Reds, but the year-long table shows them as the only team other than Liverpool to average over two points per game – 2.06, with 66 points from 32 matches.
United, with 65 from 33, are third with 1.97 PPG before the first EFL clubs come into the picture, with Championship Brentford and League One Portsmouth occupying the remaining hypothetical European places.
Doncaster, Peterborough, Cheltenham, Leeds and Sunderland complete the top 10 while the top 20, equivalent to the Premier League places, contains seven current top-flight clubs, three from the Championship, six League One and four League Two sides.
Steel City struggles
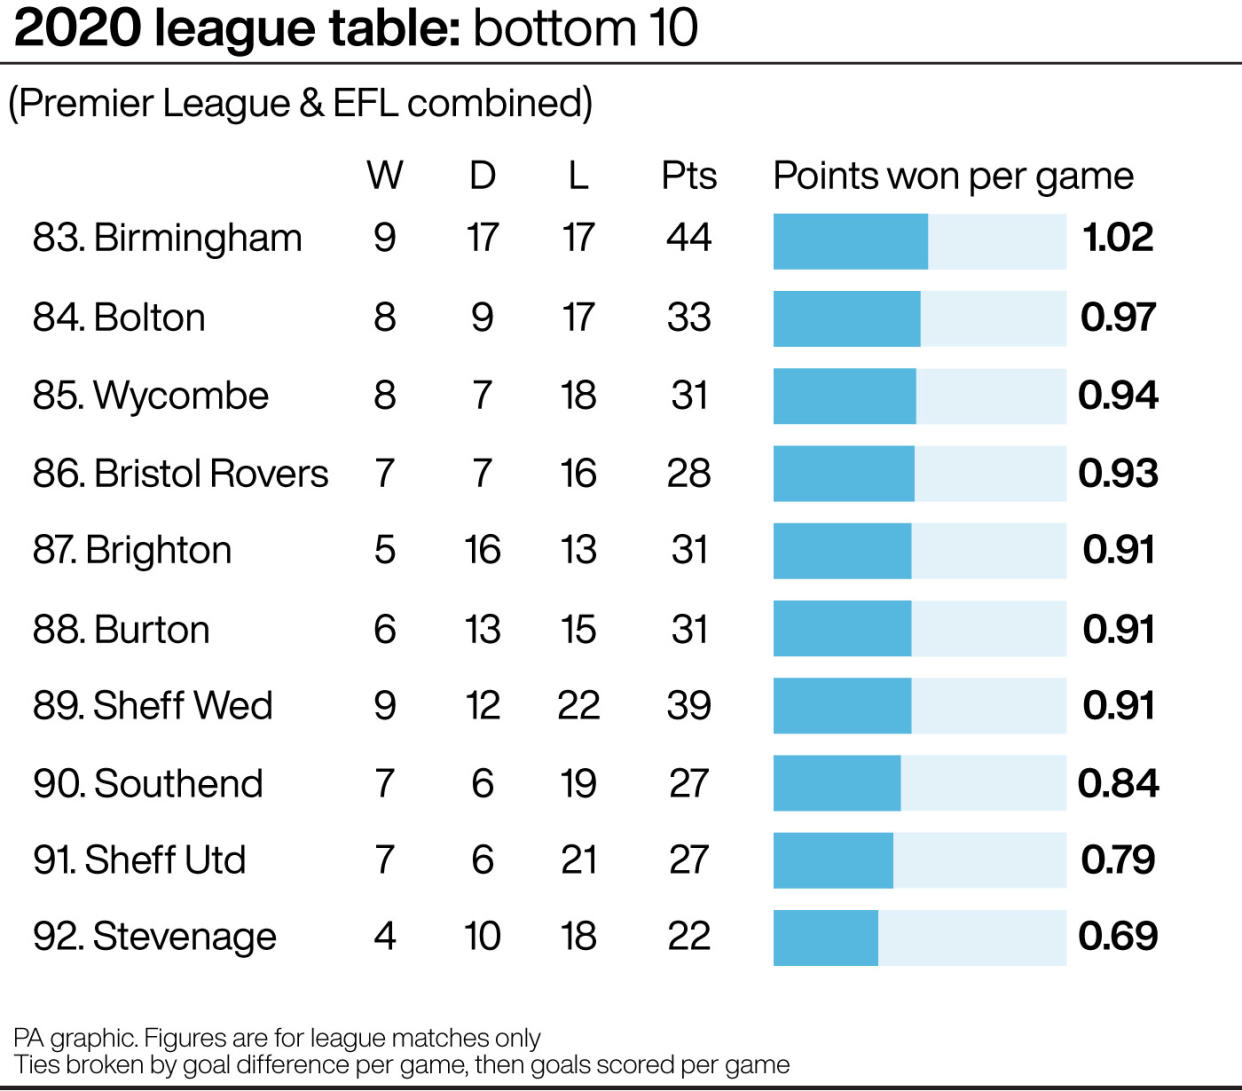
Sheffield United are still chasing their first win of the new Premier League season, with just two points from their opening 16 games, while local rivals Wednesday sacked manager Tony Pulis on Monday after only 10 games in charge.
Both clubs languish in the bottom four of our standings, with the Blades kept off the bottom only by Stevenage – who were spared relegation to the National League after Macclesfield’s points deduction was increased following an appeal by the EFL.
Stevenage had finished the truncated season with only three wins and 22 points from 36 games and have barely improved this term on their way to a year-end average of 0.69 points per game, compared to the Blades’ 0.79.
With the last league game of 2020 now over, it's time for the traditional calendar year table based on points won per game:https://t.co/7X2f1PkBvm
Explanation, observations, smaller sections of the graphic and versions from the previous five years available via the link. pic.twitter.com/VRH3okVz3l
— Ben Mayhew (@experimental361) December 30, 2020
Southend currently prop up the Football League and, on 0.84 PPG, split the Sheffield clubs with Wednesday on 0.91, below Burton and Brighton on goal difference.
Bristol Rovers, Wycombe, Bolton and Birmingham make up the rest of the bottom 10 while there are three more Premier League clubs – Crystal Palace, West Brom and Newcastle – occupying League Two places in the 12-month ranking.

