
Second doses of Covid-19 vaccine for over-60s in England, by local authority
Here is a list of the latest estimates of the proportion of people aged 60 and over in England who have received both doses of Covid-19 vaccine, broken down by local authority.
The figures are based on provisional data from NHS England for vaccinations up to May 23 and use population figures from the Office for National Statistics, which are the best publicly available official estimates.
The list is ordered by percentage starting with the highest, and reads, from left to right: name of local authority; number of people aged 60 and over resident in the local authority who have received both doses; estimated percentage of people aged 60 and over resident in the local authority who have received both doses.
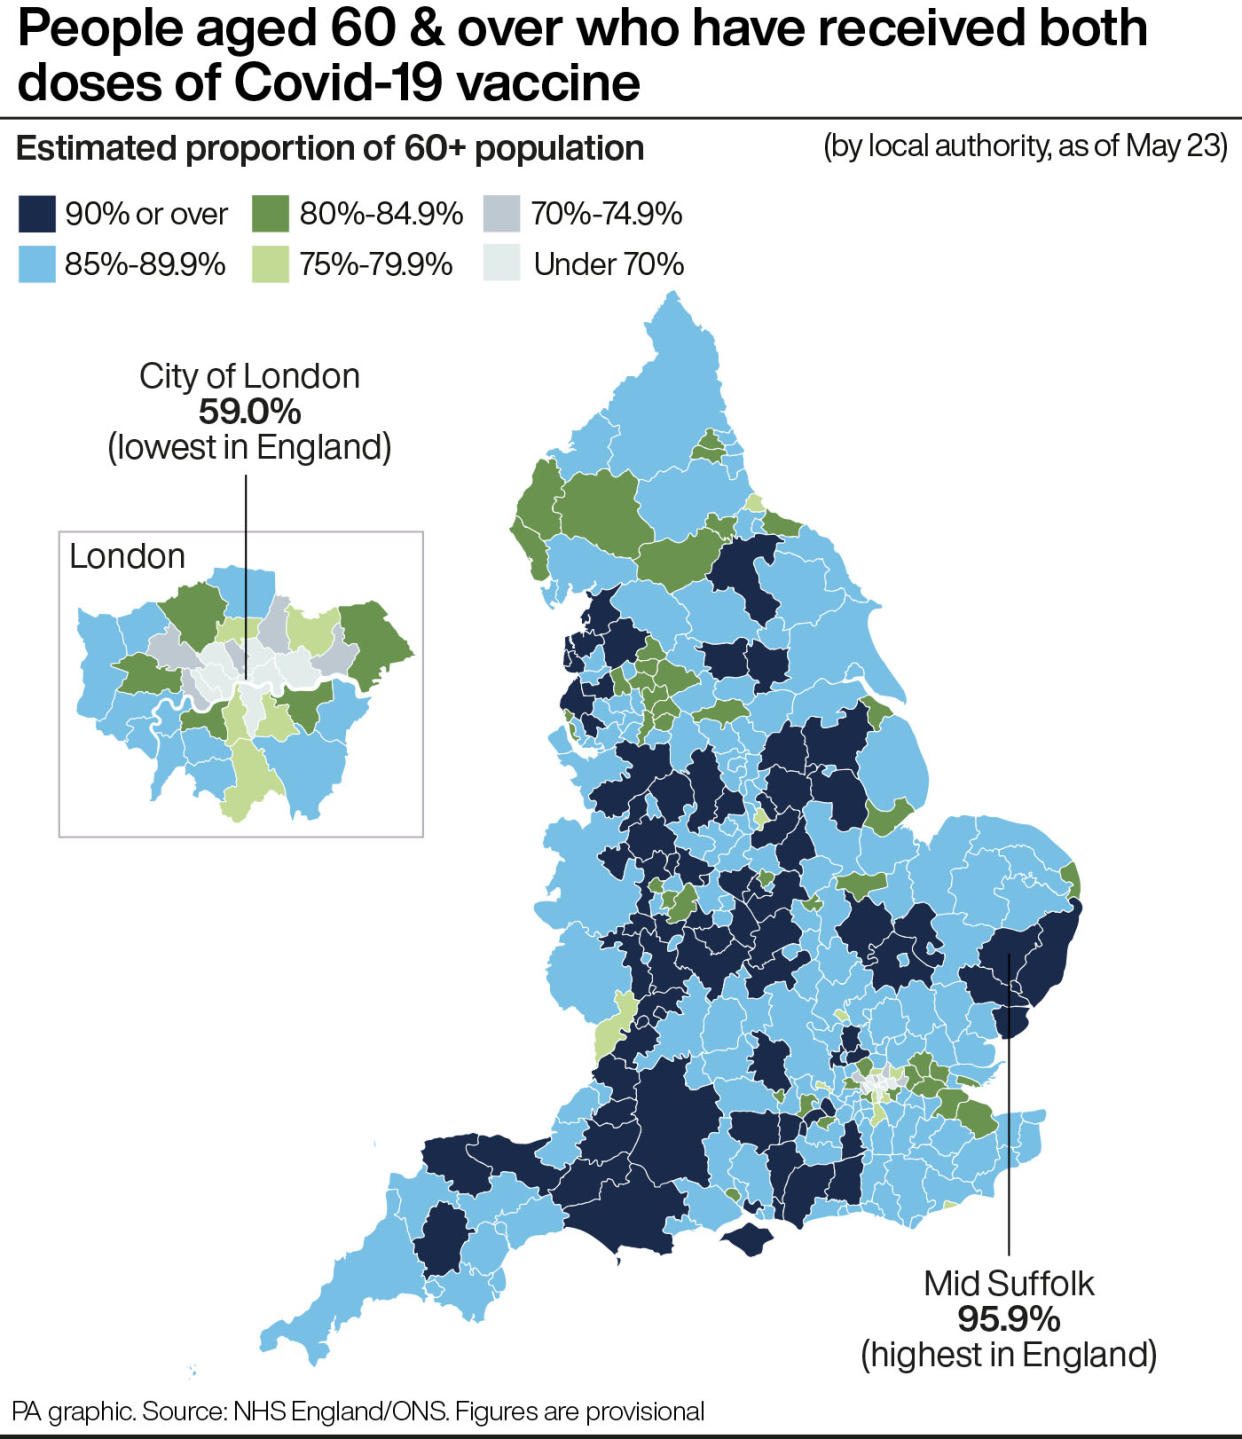
Mid Suffolk 31,260 95.9%
Stratford-on-Avon 39,874 95.6%
Telford and Wrekin 38,955 95.3%
Harborough 25,170 95.1%
Stafford 37,282 94.9%
Chichester 39,221 94.1%
Surrey Heath 21,369 93.8%
Horsham 39,175 93.5%
West Devon 18,566 93.4%
Warwick 32,193 93.3%
Wyre Forest 29,329 93.3%
Blaby 24,787 93.2%
Babergh 28,304 93.2%
Tewkesbury 25,004 93.2%
Bath and North East Somerset 43,554 93.2%
Stroud 32,669 93.1%
Cheltenham 27,116 92.9%
Staffordshire Moorlands 29,241 92.8%
Cannock Chase 23,451 92.8%
Wiltshire 129,162 92.7%
Wychavon 38,293 92.7%
South Cambridgeshire 37,198 92.6%
Rushcliffe 29,690 92.4%
Mendip 32,243 92.4%
East Suffolk 79,035 92.3%
South Staffordshire 32,504 92.2%
Daventry 21,390 92.2%
Fylde 25,843 92.1%
South Somerset 50,088 92.1%
Hart 22,591 92.0%
Lichfield 29,018 91.8%
West Lancashire 29,773 91.6%
Lancaster 34,338 91.5%
Wyre 35,598 91.4%
Basingstoke and Deane 37,139 91.4%
Selby 22,146 91.4%
North Devon 28,539 91.4%
Huntingdonshire 42,483 91.2%
Rushmoor 17,095 91.2%
East Cambridgeshire 21,445 91.1%
Fareham 31,884 91.0%
Gedling 29,021 91.0%
North Kesteven 31,534 91.0%
Bassetlaw 30,637 90.9%
Hambleton 27,908 90.9%
South Gloucestershire 62,459 90.8%
Melton 13,840 90.8%
Ribble Valley 16,981 90.8%
Blackpool 33,837 90.8%
Cheshire East 102,137 90.8%
East Hampshire 33,276 90.7%
Derbyshire Dales 22,746 90.7%
Malvern Hills 25,225 90.7%
Ipswich 27,528 90.7%
Mole Valley 23,939 90.7%
Newark and Sherwood 31,792 90.6%
Isle of Wight 45,859 90.6%
Solihull 52,317 90.6%
Hertsmere 22,586 90.5%
Somerset West and Taunton 45,808 90.5%
South Northamptonshire 22,749 90.5%
Havant 34,416 90.5%
St. Helens 43,458 90.5%
South Oxfordshire 34,609 90.4%
Hinckley and Bosworth 28,876 90.4%
Tendring 48,834 90.4%
Leeds 145,396 90.3%
Gloucester 26,067 90.3%
Dorset 124,374 90.3%
St Albans 29,607 90.3%
Newcastle-under-Lyme 30,946 90.2%
Chorley 27,561 90.2%
Rugby 23,814 90.1%
West Lindsey 27,431 90.1%
Tamworth 17,204 90.0%
Three Rivers 19,940 90.0%
Runnymede 17,576 90.0%
Bromsgrove 25,751 90.0%
Amber Valley 33,094 90.0%
Worcester 20,538 89.9%
North Somerset 58,131 89.9%
Scarborough 34,157 89.8%
Adur 17,017 89.8%
South Norfolk 38,280 89.8%
North Warwickshire 16,575 89.8%
Ryedale 17,160 89.8%
Harrogate 43,674 89.8%
Bury 40,738 89.7%
King’s Lynn and West Norfolk 44,626 89.7%
Tandridge 21,209 89.7%
Stockport 67,970 89.5%
North East Derbyshire 28,753 89.5%
Tonbridge and Malling 28,881 89.4%
Cornwall 162,687 89.4%
Maldon 18,895 89.4%
West Oxfordshire 27,568 89.4%
East Staffordshire 26,985 89.4%
South Ribble 27,334 89.3%
North Lincolnshire 42,834 89.3%
Bromley 67,177 89.3%
Broadland 37,750 89.3%
Bolsover 18,933 89.2%
Gosport 20,103 89.2%
Exeter 24,012 89.1%
North Hertfordshire 29,395 89.1%
Gravesham 21,637 89.1%
East Riding of Yorkshire 101,240 89.1%
Isles of Scilly 659 89.1%
Ashford 28,852 89.0%
East Hertfordshire 31,782 89.0%
Portsmouth 35,921 89.0%
Stoke-on-Trent 51,679 89.0%
York 44,097 89.0%
South Derbyshire 23,031 89.0%
Arun 50,712 88.9%
South Tyneside 36,248 88.9%
Swindon 43,029 88.9%
Shropshire 90,379 88.9%
Broxtowe 27,378 88.8%
Teignbridge 40,147 88.8%
East Devon 48,636 88.8%
Craven 17,700 88.8%
Breckland 39,150 88.7%
Bournemouth, Christchurch and Poole 96,135 88.7%
Cheshire West and Chester 84,591 88.7%
Cotswold 26,142 88.7%
Canterbury 38,271 88.6%
Rutland 11,270 88.6%
Bexley 47,641 88.6%
Mansfield 24,825 88.5%
Uttlesford 20,740 88.5%
Ashfield 28,397 88.5%
Central Bedfordshire 60,305 88.5%
Maidstone 37,641 88.5%
Wakefield 77,052 88.4%
Mid Sussex 35,136 88.4%
Winchester 30,107 88.4%
Colchester 38,013 88.4%
Charnwood 38,589 88.4%
Dartford 18,636 88.3%
Chesterfield 25,568 88.3%
Wealden 47,168 88.3%
Lewes 29,432 88.3%
Guildford 28,538 88.2%
Preston 24,839 88.2%
Wirral 80,663 88.1%
Warrington 45,568 88.1%
Bristol, City of 69,838 88.1%
North West Leicestershire 23,725 88.0%
Chelmsford 38,868 88.0%
Waverley 31,164 88.0%
Sevenoaks 29,123 88.0%
Kettering 21,512 88.0%
Windsor and Maidenhead 32,079 87.9%
Folkestone and Hythe 31,136 87.9%
Tunbridge Wells 26,095 87.9%
Rother 33,377 87.9%
Harrow 47,042 87.8%
Lincoln 17,424 87.8%
Wokingham 34,651 87.8%
Derby 48,212 87.8%
West Berkshire 35,308 87.8%
Erewash 26,754 87.8%
Oadby and Wigston 13,718 87.8%
Epsom and Ewell 16,592 87.7%
Cherwell 31,584 87.7%
East Northamptonshire 22,464 87.7%
Northampton 40,359 87.6%
Bolton 57,034 87.6%
Reigate and Banstead 30,707 87.6%
Buckinghamshire 117,166 87.6%
Nuneaton and Bedworth 28,465 87.5%
Dudley 73,022 87.5%
Rochford 22,454 87.4%
Worthing 27,503 87.4%
Kingston upon Hull, City of 46,109 87.3%
South Hams 27,378 87.2%
Sedgemoor 32,773 87.2%
Elmbridge 28,478 87.2%
Stockton-on-Tees 42,169 87.1%
Kirklees 89,043 87.1%
County Durham 126,088 87.0%
Plymouth 54,892 87.0%
Harlow 15,687 87.0%
Trafford 46,953 87.0%
Wellingborough 17,541 87.0%
Richmond upon Thames 36,098 87.0%
Torbay 40,096 87.0%
South Kesteven 36,854 86.9%
Sunderland 63,468 86.8%
Vale of White Horse 30,573 86.8%
Herefordshire, County of 52,904 86.8%
Barrow-in-Furness 16,312 86.8%
Spelthorne 20,915 86.8%
Mid Devon 21,516 86.8%
West Suffolk 41,525 86.7%
Fenland 25,842 86.7%
Norwich 23,679 86.7%
Halton 27,683 86.7%
High Peak 22,608 86.7%
Broxbourne 19,580 86.7%
New Forest 56,550 86.6%
Eastbourne 27,889 86.6%
Torridge 21,083 86.6%
Merton 30,960 86.6%
Cambridge 18,627 86.5%
Stevenage 15,874 86.5%
Bedford 35,134 86.5%
Rotherham 59,039 86.5%
Eastleigh 29,452 86.5%
Test Valley 30,424 86.5%
Middlesbrough 26,986 86.5%
North Norfolk 37,244 86.4%
Brighton and Hove 44,305 86.4%
Coventry 56,710 86.3%
Crawley 18,156 86.3%
Dover 31,076 86.2%
Sheffield 105,511 86.2%
Salford 42,018 86.2%
East Lindsey 46,364 86.2%
Northumberland 89,567 86.1%
Knowsley 30,863 86.1%
Wigan 70,231 86.1%
Watford 14,773 86.0%
Milton Keynes 44,694 86.0%
Bradford 93,432 86.0%
Dacorum 30,769 85.9%
Welwyn Hatfield 21,491 85.8%
Enfield 51,499 85.8%
Hillingdon 47,737 85.8%
Hounslow 39,414 85.8%
Walsall 55,449 85.7%
South Lakeland 32,431 85.7%
Epping Forest 28,662 85.6%
Doncaster 67,495 85.6%
Carlisle 26,575 85.5%
Sutton 35,647 85.4%
Redditch 17,689 85.4%
Hyndburn 16,596 85.4%
Kingston upon Thames 28,055 85.3%
Castle Point 24,386 85.3%
South Holland 24,789 85.2%
North Tyneside 47,122 85.1%
Thanet 36,458 85.1%
Braintree 34,178 85.1%
Sefton 71,378 84.9%
Basildon 35,816 84.9%
Peterborough 33,692 84.8%
Boston 16,050 84.6%
Oldham 42,626 84.6%
Tameside 44,570 84.5%
Sandwell 55,162 84.5%
Brentwood 16,909 84.4%
Calderdale 44,338 84.4%
Medway 50,321 84.3%
Woking 19,300 84.3%
Barnet 63,984 84.3%
Allerdale 26,101 84.3%
Wolverhampton 48,119 84.3%
Great Yarmouth 25,850 84.3%
Liverpool 83,500 84.2%
Darlington 24,020 84.2%
Blackburn with Darwen 24,720 84.1%
Copeland 17,152 83.8%
Leicester 49,316 83.6%
Oxford 20,782 83.0%
Rossendale 14,676 83.0%
Reading 22,532 83.0%
Birmingham 164,201 83.0%
Bracknell Forest 20,397 82.9%
Southampton 37,268 82.9%
Redcar and Cleveland 33,190 82.8%
Ealing 50,713 82.8%
Havering 50,094 82.7%
Rochdale 40,334 82.7%
Gateshead 42,870 82.6%
Swale 31,041 82.6%
Wandsworth 35,527 82.5%
Thurrock 26,428 82.5%
North East Lincolnshire 35,131 82.4%
Southend-on-Sea 37,427 82.3%
Burnley 17,992 82.2%
Corby 11,564 82.0%
Barnsley 52,100 81.9%
Newcastle upon Tyne 47,837 81.6%
Manchester 57,714 81.1%
Greenwich 34,038 80.9%
Eden 14,900 80.7%
Pendle 18,211 80.5%
Richmondshire 12,121 80.4%
Nottingham 41,728 79.9%
Redbridge 41,964 79.5%
Hastings 19,260 78.4%
Hartlepool 18,856 78.1%
Forest of Dean 21,461 78.0%
Slough 16,708 77.8%
Luton 27,824 76.9%
Croydon 55,663 76.3%
Haringey 29,675 75.9%
Lambeth 29,938 75.8%
Lewisham 31,335 75.7%
Waltham Forest 30,935 74.6%
Islington 22,243 74.4%
Barking and Dagenham 20,489 73.9%
Brent 42,373 73.7%
Hammersmith and Fulham 19,910 71.9%
Southwark 27,851 69.8%
Hackney 21,164 67.7%
Newham 26,193 65.8%
Kensington and Chelsea 21,593 65.1%
Camden 28,086 64.9%
Tower Hamlets 18,487 61.2%
Westminster 25,969 59.1%
City of London 1,283 59.0%

