
Figures show 'levelling-off' of life expectancy growth rates

Growth in life expectancy has stalled across many areas of the UK, new figures suggest.
Only 26 areas of the country recorded a significant jump in life expectancy for males between 2011/13 and 2014/16, compared with 203 areas between 2001/03 and 2004/06. The equivalent number for females has fallen from 128 areas to 17.
Though life expectancy is continuing to increase in all parts of the UK, there is big variation between areas.
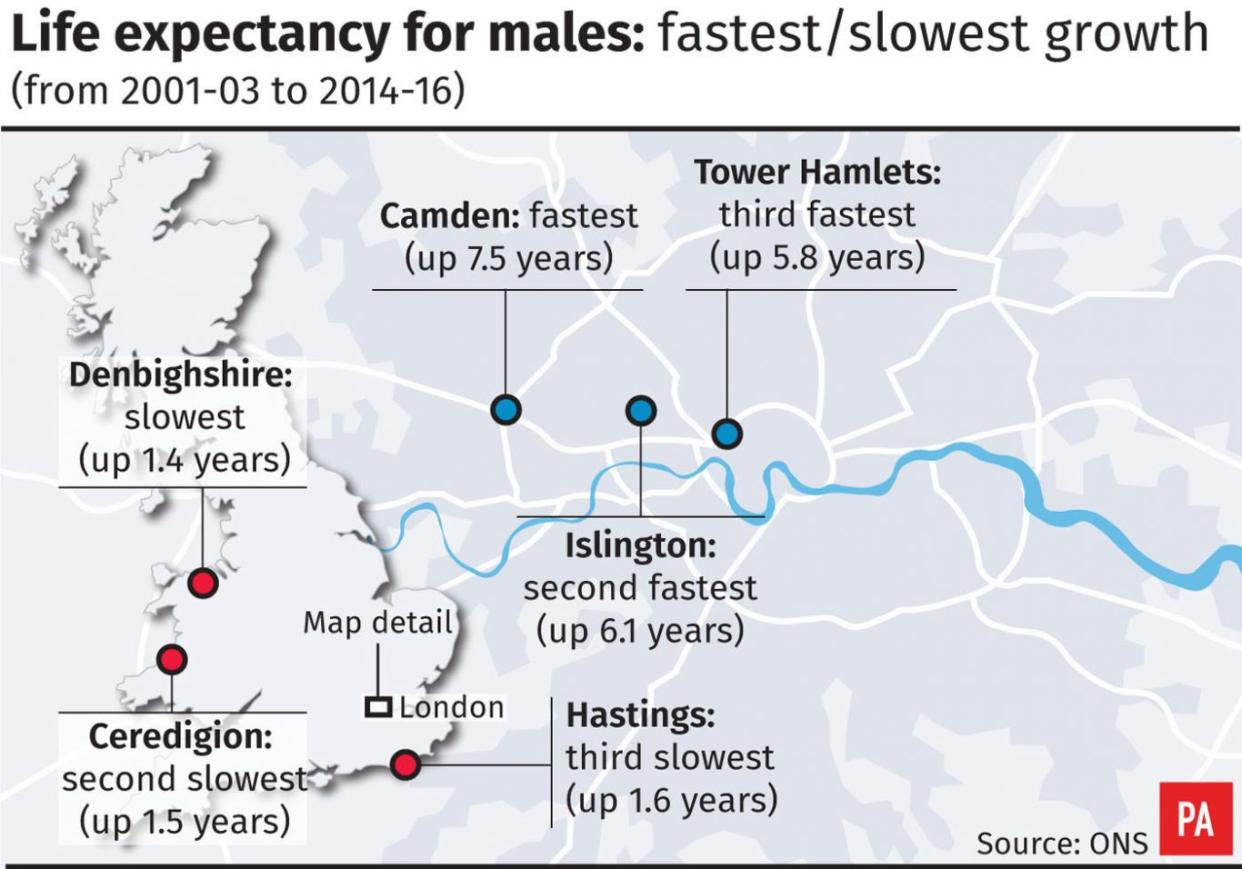
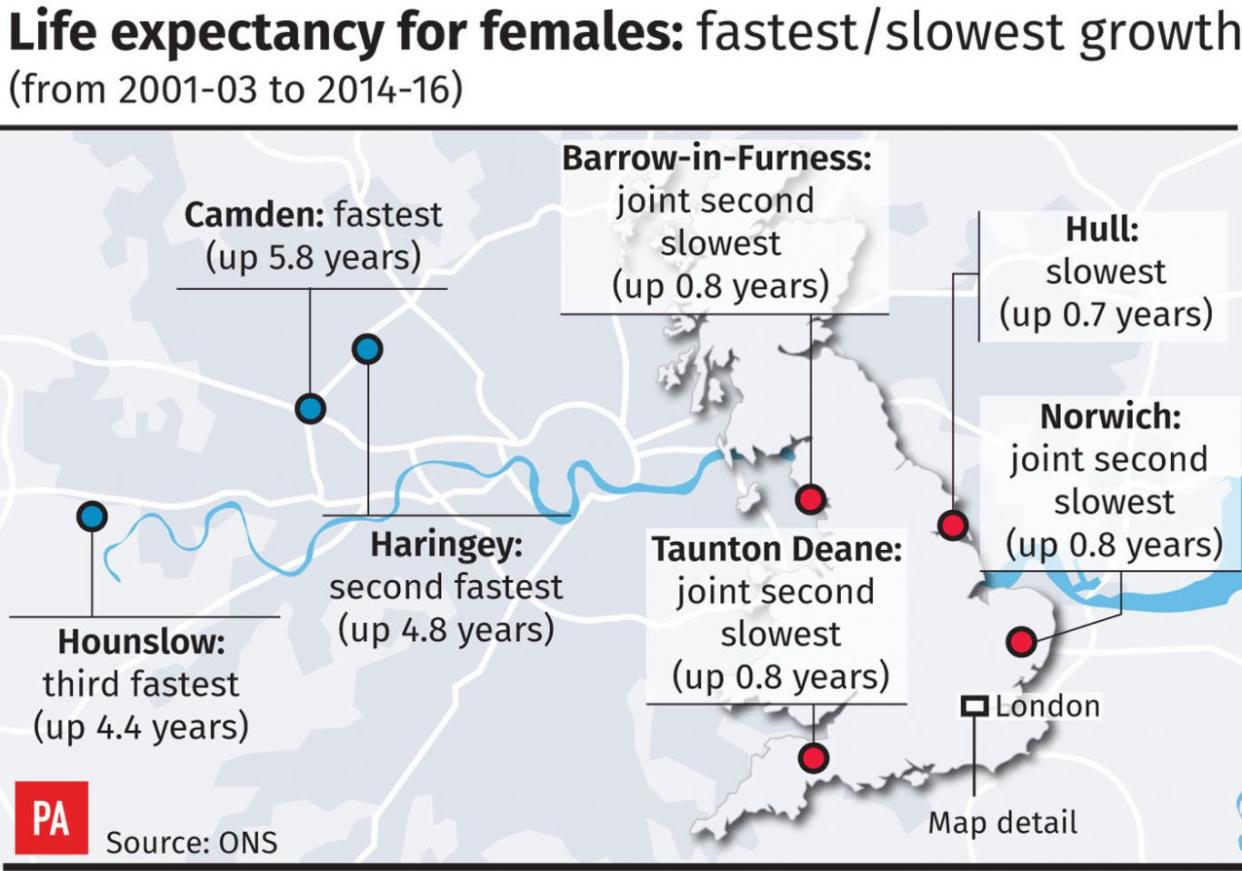
The London borough of Camden saw the fastest improvement in life expectancy between 2001/03 and 2014/16 for both males (7.5 years) and females (5.8 years).
By contrast, Denbighshire in north Wales saw the slowest improvement for males (1.4 years), while Hull recorded the smallest improvement for females (0.7 years).
The figures, from the Office for National Statistics (ONS), show the overall rate of improvement in life expectancy at birth during the first half of this decade was 75.3% lower for males and 82.7% lower for females when compared with the first half of the previous decade.
Chris White, principal researcher at the ONS, said further studies would be needed to understand what is driving the slowdown in improvement.
He said: "We have seen a trend of a levelling-off of gains in life expectancy, that has been reported in a lot of research reports since around 2011.
"There is quite an intense debate at the moment about what is driving that: some people point to provisions in social care or health epidemics and other factors affecting older people, so there is a lot going on.
"Some of it is really just related to the ageing of a modern population but the trend in the data is definitely pointing to a thaw in the rate of improvement and it does require further research to unpick what is driving it."
Life expectancy has improved fastest in the London borough of Camden, 7.5 years for males and 5.8 years for females https://t.co/xaL9kUCMGc
-- ONS (@ONS) December 7, 2017
The ONS will be producing further studies next year on what ages are most affecting the improvement rates, and what causes of death might be driving the slowdown, he added.
The figures also show that healthy life expectancy, a person's lifespan spent in good health, differs by as much as 18 years across parts of the UK.
The London Borough of Richmond upon Thames recorded the highest healthy life expectancy of anywhere in the country for men between 2014/16 (69.9 years), while the Orkney Islands saw the highest for women (73.0 years).
By contrast, Dundee saw the lowest healthy life expectancy for men (54.3 years), and Manchester for women (54.6 years).
The variation across different areas of the UK amounted to "stark contrasts" in the number of years people can expect to live in good health, the ONS said.
Today's UK health state life expectancy (2014 - 16) bulletin includes two measures of longevity for the first time; the median and modal age at death https://t.co/xaL9kUCMGc
-- ONS (@ONS) December 7, 2017
Chief executive of the older people's charity Independent Age, Janet Morrison, said there were "deep-rooted health inequalities" contributing to the slowdown in gains across the country.
She said: "It is deeply concerning that people in some parts of the country can still expect to have over fifteen years more good health than people living elsewhere, while overall increases in life expectancy are slowing down.
"It is imperative that the reasons for these persistent health inequalities are understood and addressed, to ensure that older age is not just about living longer, but having a good quality of life in older age, no matter where in the UK you live."
(function(i,s,o,g,r,a,m){i['GoogleAnalyticsObject']=r;i[r]=i[r]function(){(i[r].q=i[r].q[]).push(arguments)},i[r].l=1*new Date();a=s.createElement(o),m=s.getElementsByTagName(o)[0];a.async=1;a.src=g;m.parentNode.insertBefore(a,m)})(window,document,'script','//www.google-analytics.com/analytics.js','ga');ga('create', 'UA-72310761-1', 'auto', {'name': 'pacontentapi'});ga('pacontentapi.set', 'referrer', location.origin);ga('pacontentapi.set', 'dimension1', 'By PA Reporters');ga('pacontentapi.set', 'dimension2', '964b063f-fc74-477d-ac04-6ffcba010ee5');ga('pacontentapi.set', 'dimension3', 'paservice:news,paservice:news:uk');ga('pacontentapi.set', 'dimension6', 'story-enriched');ga('pacontentapi.set', 'dimension7', 'composite');ga('pacontentapi.set', 'dimension8', 'paasset:graphic');ga('pacontentapi.set', 'dimension9', null);ga('pacontentapi.send', 'pageview', { 'location': location.href, 'page': (location.pathname + location.search + location.hash), 'title': 'Figures show \u2018levelling-off\u2019 of life expectancy growth rates'});

